AI In Healthcare & Medicine — Beginner
Understand AI in scans—what it can do, where it fits, and the risks.
AI is showing up in radiology and other imaging-heavy specialties fast. You may hear that it can “find disease earlier,” “reduce workload,” or “automate reading.” As a beginner, it’s hard to tell what’s real, what’s marketing, and what questions you should be asking to protect patients and your organization.
This course is a short, book-style guide that explains AI in medical imaging from first principles—no coding, no advanced math, and no prior AI background. You’ll learn what imaging AI tools actually do, where they tend to help most, and the practical risks to watch for when tools move from demos into real clinical workflows.
This course is designed for absolute beginners: clinicians in training, healthcare administrators, compliance and risk teams, product and operations staff, policy stakeholders, and anyone who needs a clear mental model of “how AI works in scans” without becoming a data scientist.
We start by defining the medical imaging workflow—order to scan to read to report—so you can see exactly where software can help and where it can’t. Then we explain how AI “sees” images by learning patterns from many examples, and how it produces outputs like scores, boxes, or highlighted regions. From there, you’ll explore the most common clinical use cases, such as triage, detection support, measurements over time, and workflow automation.
Next, you’ll learn the performance basics that are often misunderstood: sensitivity, specificity, false positives, and false negatives. You’ll also learn why results can change when a tool moves to a new hospital, a different scanner, or a different patient population. Finally, you’ll study the major risks—bias, drift, poor data quality, and overreliance—and end with adoption essentials like privacy, regulation, governance, and vendor evaluation.
The course is organized as six short chapters that build on each other. Each chapter includes milestones (so you know what you can do by the end) and focused sections that introduce key ideas step by step. By the end, you’ll have a practical checklist of questions to ask and a clearer understanding of what “safe and effective” can mean for AI in medical imaging.
If you’re ready to learn AI in medical imaging without the jargon, you can Register free and begin right away. Prefer to explore other topics first? You can also browse all courses on Edu AI.
Healthcare AI Educator & Medical Imaging Workflow Specialist
Sofia Chen designs beginner-friendly training on how AI systems are evaluated and used in clinical imaging workflows. She has supported hospital teams in adopting imaging software safely, focusing on quality, bias, and patient-centered outcomes.
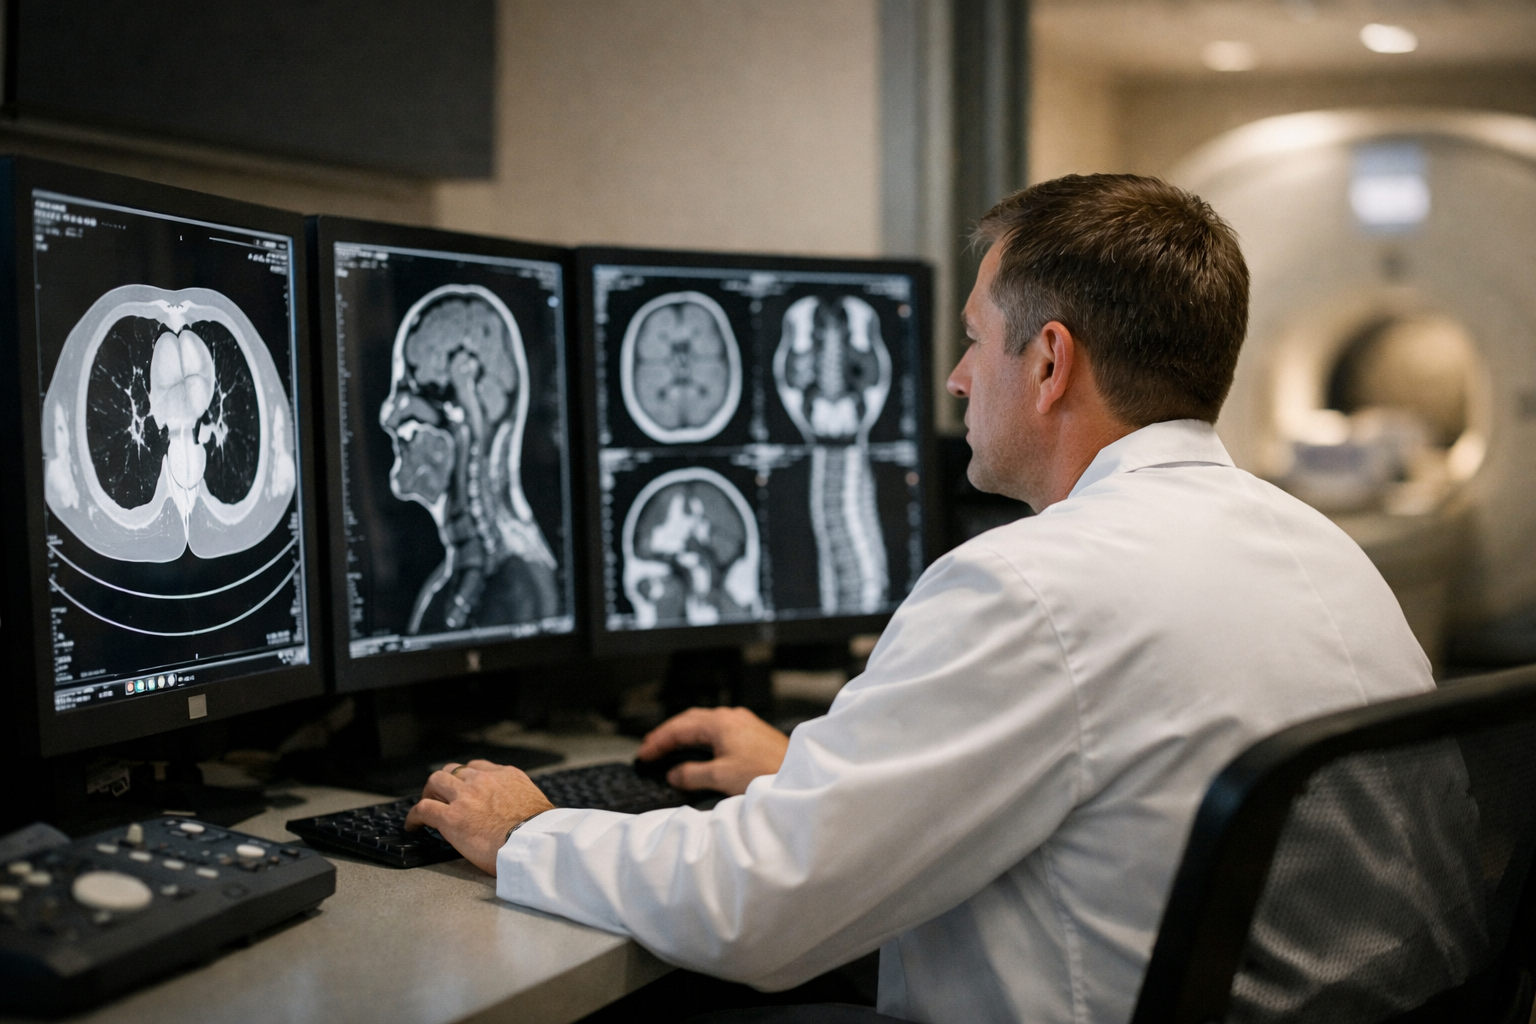
Medical imaging is one of the most data-rich parts of healthcare: every day, hospitals and clinics produce large volumes of X-rays, CT scans, MRIs, and ultrasound images. These images help clinicians see what physical exams and lab tests cannot—fractures, strokes, tumors, bleeding, pneumonia, blocked vessels, and more.
AI in medical imaging is best understood as a set of tools that can learn patterns from many prior examples and then assist humans with specific tasks. It does not “understand” disease the way a clinician does, and it cannot take responsibility for a patient’s care. In practice, imaging AI is used to detect findings, triage urgent studies, measure anatomy or lesions consistently, and support reporting workflows.
This chapter gives you a beginner-friendly map of how imaging fits into care, what people mean by “AI,” where the hype tends to creep in, and what realistic capabilities look like. You’ll also learn how imaging data becomes model inputs, why training/testing/real-world use are different, and how to think clearly about performance and common failure modes such as bad data, bias, and drift.
Practice note for Milestone: Define medical imaging and where it fits in care: document your objective, define a measurable success check, and run a small experiment before scaling. Capture what changed, why it changed, and what you would test next. This discipline improves reliability and makes your learning transferable to future projects.
Practice note for Milestone: Understand what people mean by “AI” (in simple terms): document your objective, define a measurable success check, and run a small experiment before scaling. Capture what changed, why it changed, and what you would test next. This discipline improves reliability and makes your learning transferable to future projects.
Practice note for Milestone: Separate hype from realistic capabilities: document your objective, define a measurable success check, and run a small experiment before scaling. Capture what changed, why it changed, and what you would test next. This discipline improves reliability and makes your learning transferable to future projects.
Practice note for Milestone: Map the main imaging AI use cases you’ll hear about: document your objective, define a measurable success check, and run a small experiment before scaling. Capture what changed, why it changed, and what you would test next. This discipline improves reliability and makes your learning transferable to future projects.
Practice note for Milestone: Learn the key stakeholders and why alignment matters: document your objective, define a measurable success check, and run a small experiment before scaling. Capture what changed, why it changed, and what you would test next. This discipline improves reliability and makes your learning transferable to future projects.
“Medical imaging” covers technologies that create pictures of the inside of the body for diagnosis, monitoring, and treatment planning. Four modalities come up constantly in imaging AI conversations: X-ray, CT, MRI, and ultrasound. Each creates different kinds of data and has different strengths, which matters because AI systems learn from what the images actually contain.
X-ray is fast, inexpensive, and common in emergency and inpatient care. It produces a 2D projection image, which can make subtle findings difficult because anatomy overlaps. AI often targets high-volume tasks here (for example, possible pneumonia or fractures) because even small time savings at scale can matter.
CT (computed tomography) creates many cross-sectional slices and is excellent for acute problems like stroke, trauma, pulmonary embolism, and abdominal pain. Because CT has consistent image geometry and rich detail, AI can perform detection and measurement tasks well—yet performance still depends heavily on scanner settings and patient population.
MRI provides excellent soft-tissue contrast and many “sequences” (different ways of highlighting tissue properties). That flexibility helps clinicians, but it adds complexity for AI: a model trained on one protocol may struggle when the sequence mix changes.
Ultrasound is real-time and portable, but highly operator-dependent. The same patient can look different depending on probe angle, pressure, and skill. AI can assist with image quality guidance, measurements, or identifying standard views, but the variability increases the risk of failure if training data is narrow.
That question is your first step in separating realistic capability from broad, hype-driven statements.
Imaging is not just “a scan.” It is a workflow that spans multiple teams and systems. Understanding this journey helps you see where AI can help—and where it can quietly create risk if it disrupts coordination.
Order: A clinician requests an exam for a clinical question (e.g., “rule out pulmonary embolism”). The order includes patient context, symptoms, and urgency. A common mistake is assuming the image alone is the whole story; in reality, clinical context shapes how findings are interpreted.
Scan: Technologists acquire images using a protocol (settings, sequences, contrast timing). Small protocol differences can change pixel values and appearance. For AI, this is a major source of “bad data” in practice: the model expects one style of image but receives another.
Read: Radiologists interpret the images, often comparing to prior studies and integrating clinical history. This is where “AI as assistance” is most natural: flagging possible findings, suggesting measurements, or surfacing similar prior cases—without replacing the clinician’s reasoning.
Report: Findings and impressions are documented and sent to the ordering team. Reporting is also a data output: it becomes labels for future training, billing codes, and part of the medical record. If the report is vague or inconsistent, the labels extracted from it can be unreliable.
Treat: The clinical team acts—ordering follow-up imaging, starting therapy, consulting specialists, or discharging the patient. The true value of imaging AI is measured here: did it help the patient pathway, reduce time-to-treatment, or prevent harm?
Stakeholder alignment—radiology, ED, IT, compliance, and vendors—matters because even a strong model can fail if it is inserted into the wrong step or creates extra work.
In medical imaging, “AI” usually means machine learning, often deep learning, where a model learns patterns from examples rather than following hand-coded rules. That difference is critical. Rules-based software might say: “If pixel intensity exceeds threshold X, mark as abnormal.” AI instead learns from many labeled images what combinations of shapes, textures, and context tend to align with a diagnosis or measurement.
A helpful mental model is: rules-based software is like a checklist; AI is like an apprentice who studies thousands of past cases and learns what experts tend to call “positive” or “negative.” But the apprentice does not truly understand anatomy or causality—it recognizes statistical patterns that were present in the training examples.
This is why training, testing, and real-world use differ. During training, the model sees many examples and adjusts itself to reduce error. During testing, it is evaluated on held-out examples to estimate performance. In real-world deployment, the environment changes: new scanners, new patient populations, new protocols, and new disease prevalence. These shifts can cause drift, where performance slowly degrades over time.
AI is powerful for pattern recognition, but it is not a general medical decision-maker. Treat it as a tool that can be reliable in a defined scope and unreliable outside it.
To evaluate imaging AI, you need a small set of shared vocabulary. A dataset is a collection of imaging studies (and often associated metadata). A label is the “answer” attached to each example—such as “intracranial hemorrhage present” or a bounding box around a lung nodule. Labels can come from radiology reports, expert review, pathology results, or follow-up imaging, and label quality is one of the biggest drivers of real-world performance.
An algorithm is the method used to learn (for example, a training procedure or neural network architecture). A model is the trained result—what you actually run on new images to produce predictions. In day-to-day conversation, people often blur these terms, but the distinction matters when troubleshooting. If performance is poor, you may need to ask: is it the model’s learned behavior, or is it the data pipeline feeding it the wrong inputs?
Two performance terms you will see immediately are sensitivity and specificity. Sensitivity is “how many true positives it catches” (low sensitivity means missed cases). Specificity is “how many true negatives it leaves alone” (low specificity means too many false alarms). Imagine 100 CT head scans where 10 truly have a bleed. If the AI flags 9 of the 10 bleeds, sensitivity is 90%. If it also flags 18 of the 90 normal scans as bleeds, specificity is 80% (because 72/90 normals were correctly not flagged).
These terms provide a baseline for communicating with clinicians, vendors, and compliance teams in the same language.
Imaging AI can appear in multiple places, and the “where” often determines whether it helps or frustrates users. First, AI may be embedded in the scanner itself. Examples include reconstruction or denoising that improves image quality or reduces radiation dose in CT. These tools may not look like “diagnosis AI,” but they can meaningfully affect downstream interpretation and even the performance of other models (because the image appearance changes).
Second, AI commonly lives on the radiologist workstation (PACS or viewer). Here it can highlight suspicious regions, generate measurements, or propose structured text for the report. Workstation integration succeeds when it reduces clicks, is fast, and makes it easy to verify the suggestion. It fails when it adds steps or hides uncertainty.
Third, AI can operate in the inbox—for example, triaging a worklist so urgent cases move up, or notifying an on-call team when a suspected critical finding appears. This is a high-impact area but also high-risk: a false negative can delay care, and a false positive can create unnecessary escalations. Alignment across stakeholders (radiology, ED, stroke team, IT operations) is essential so everyone agrees on who receives alerts, when, and what action is expected.
Understanding placement helps you ask practical questions about latency, verification, and failure handling.
The most realistic framing is: imaging AI is a clinical assistance technology. It can increase consistency, speed up routine measurements, and help teams respond faster to time-critical findings. It can also reduce cognitive load by acting like a second set of eyes—especially in high-volume settings where humans are tired and interruptions are frequent.
Common benefit categories include: detection (flagging possible abnormalities), triage (prioritizing studies), measurement (quantifying lesions, chamber sizes, hemorrhage volume), and reporting assistance (structured templates, auto-populated measurements). These are focused tasks with clear inputs and outputs—ideal for pattern-learning systems.
Limits matter just as much. AI may fail on unusual anatomy, uncommon diseases, or patient groups underrepresented in training data—this is bias in practice. It may fail when protocols change, a new scanner is installed, or reconstruction software is updated—this is drift. It may fail because the ground-truth labels were noisy (for example, extracted from inconsistent reports), leading the model to learn the wrong patterns. Importantly, a model can be “accurate on average” and still be unsafe if it fails in predictable, clinically important subgroups.
The goal is not replacement of clinicians, but a safer, faster imaging pathway—built on realistic expectations, careful evaluation, and aligned stakeholders who agree on how the tool will be used.
1. Which description best matches what AI in medical imaging is in this chapter?
2. Why is medical imaging described as one of the most data-rich parts of healthcare?
3. Which set of tasks best represents realistic current uses of AI in medical imaging?
4. What is the key difference the chapter highlights between training/testing and real-world use of imaging AI?
5. Which option best reflects the chapter’s guidance on where AI systems commonly fail or degrade over time?
When people say “AI can read scans,” it’s easy to imagine a human-like understanding: recognizing a tumor the way a radiologist does, connecting it to symptoms, and explaining what it means. In reality, medical imaging AI starts from something much simpler: numbers. A scan is a structured grid of values, and an AI model is a pattern-finding system that learns which numerical patterns tend to appear alongside a label such as “pneumothorax present” or “lung nodule here.” This is powerful, but it is also limited: the model does not “know” anatomy the way clinicians do, and it does not automatically understand clinical context unless that context is explicitly provided as inputs.
This chapter demystifies the pipeline from pixels to predictions without requiring math. You’ll learn how images become model inputs, why labels are hard to obtain, how training differs from real-world use, and how task type determines what the AI produces (a score, a box, a mask, or a measurement). Along the way, we’ll connect these mechanics to practical outcomes—what can go wrong, what “good performance” really means, and what kinds of engineering judgment keep systems safe.
Keep a simple mental model: image → preprocessing → model → output → clinical workflow. The details matter because many failures happen in the transitions: wrong input format, inconsistent labels, or a model deployed into a setting that looks different from the training data.
Practice note for Milestone: Understand images as numbers (pixels/voxels) without math fear: document your objective, define a measurable success check, and run a small experiment before scaling. Capture what changed, why it changed, and what you would test next. This discipline improves reliability and makes your learning transferable to future projects.
Practice note for Milestone: Learn what labels are and why they’re hard to get right: document your objective, define a measurable success check, and run a small experiment before scaling. Capture what changed, why it changed, and what you would test next. This discipline improves reliability and makes your learning transferable to future projects.
Practice note for Milestone: Grasp the idea of training vs inference: document your objective, define a measurable success check, and run a small experiment before scaling. Capture what changed, why it changed, and what you would test next. This discipline improves reliability and makes your learning transferable to future projects.
Practice note for Milestone: Connect task type to output type (box, mask, score, text): document your objective, define a measurable success check, and run a small experiment before scaling. Capture what changed, why it changed, and what you would test next. This discipline improves reliability and makes your learning transferable to future projects.
Practice note for Milestone: Understand images as numbers (pixels/voxels) without math fear: document your objective, define a measurable success check, and run a small experiment before scaling. Capture what changed, why it changed, and what you would test next. This discipline improves reliability and makes your learning transferable to future projects.
AI “sees” medical images as grids of numbers. In a 2D image (like a single X-ray), each pixel has a value representing brightness. In a 3D scan (like CT or MRI), each tiny cube is a voxel with a value. The model does not start with the concept of “lung” or “bone”; it starts with patterns of values across neighboring pixels/voxels.
Different modalities look different because their numbers mean different things. In CT, voxel values relate to tissue density and are often expressed in Hounsfield Units (HU). Air, fat, soft tissue, and bone fall into different HU ranges, which is why “windowing” (lung window, bone window) changes what you can see. In MRI, brightness depends on acquisition settings (T1, T2, FLAIR, diffusion, etc.) and is not directly comparable across scanners or protocols. That variability is a key practical issue for AI: a model trained on one MRI protocol may struggle on another if the intensity patterns shift.
Engineering judgment often shows up in preprocessing choices: normalizing intensities, applying the right windowing for CT, or standardizing MRI intensity ranges. These choices can make the difference between a robust model and one that fails when the scanner, site, or protocol changes.
Clinicians experience a CT or MRI as a scrollable stack of slices, often with multiple series (different phases, reconstructions, or sequences). AI must be told what its input is: a single 2D image, a set of slices, a full 3D volume, or multiple series combined. This is not a cosmetic detail—input definition shapes what the model can learn and what errors it might make.
Most imaging data arrives in DICOM format. Besides pixel values, DICOM contains metadata: pixel spacing, slice thickness, orientation, scanner model, acquisition parameters, and sometimes patient positioning. Some AI systems use only the pixel array; others use metadata to correctly convert pixel distances into real-world units (mm) or to align slices. If metadata is missing or inconsistent, measurements can be wrong even when the model “looks right.”
In real deployments, input handling is a major source of hidden risk. A system may be accurate in a controlled test but fail when connected to a hospital PACS because series naming conventions differ, images are rotated, or the expected reconstruction kernel is unavailable. Robust AI requires clear input specifications and strong validation of what is actually being fed into the model.
For AI to learn, it needs examples paired with labels. A label is the “answer” the model is trained to predict: disease present/absent, location of a finding, or a precise outline of a structure. In medical imaging, labels are expensive because they require expertise, time, and careful definitions. Even experts disagree—sometimes because the case is genuinely ambiguous, and sometimes because the label definition is unclear.
Common label sources include radiology reports (natural language), structured outcomes (e.g., pathology results), and human annotations such as boxes or segmentation masks. Each has tradeoffs. Reports scale well but can be noisy: a report might mention “no pulmonary embolism” but also discuss “subsegmental artifacts,” confusing automated label extraction. Pixel-level masks are precise but slow and costly to produce, and different annotators may draw boundaries differently.
Engineering judgment matters in label design: defining what counts as a positive case, handling “uncertain” findings, and deciding when to exclude borderline examples. It also matters in adjudication—using multiple readers, consensus reads, or tie-breaker processes. Better labels usually mean safer outputs, but you must balance label quality, cost, and the clinical importance of the task.
Training is the phase where the model learns patterns by seeing many labeled examples. Think of it as adjusting internal settings until the model’s outputs match the labels as often as possible. The model is not memorizing one image at a time; it is learning statistical regularities—what patterns tend to appear in positives versus negatives, or what boundaries tend to separate an organ from surrounding tissue.
In practice, training requires splitting data into at least three groups: training, validation (for tuning and early stopping), and testing (for final, unbiased evaluation). This separation matters because a model can look excellent on data it has effectively “seen” (directly or indirectly) and still perform poorly on new data. Leakage—where similar images from the same patient or scanner end up in both training and test sets—can create overly optimistic results.
Performance terms connect directly to workflow. High sensitivity means fewer missed cases (important for triage), but it may increase false positives that burden clinicians. High specificity reduces false alarms but risks misses. Teams choose operating points based on clinical risk: missing an intracranial hemorrhage is far more serious than flagging a few extra scans for review. Training is where you start shaping that balance, but it must be confirmed on truly independent test sets and, ideally, across multiple sites.
Inference is what happens after training, when the model is deployed (or run in a study) to analyze a new scan it has never encountered. The model takes the input (image pixels/voxels and sometimes metadata), applies the learned patterns, and produces an output—often in seconds. This is the “AI in action” moment, but it is also where real-world complexity hits: different scanners, different patient populations, motion artifacts, implants, unusual anatomy, and protocol variations.
Because inference happens inside clinical operations, reliability and integration matter as much as raw accuracy. Questions to ask include: Does the model receive the intended series every time? What happens if the scan is incomplete? Does it time out? Does it fail silently? Does it produce a confidence score and a meaningful warning when the input is out of scope?
In real use, inference outputs should be treated as decision support, not a final diagnosis. Safe systems include monitoring dashboards, periodic re-evaluation, and clear clinical governance: who reviews false negatives, how feedback is captured, and when a model should be retrained or retired. The difference between a promising demo and a dependable clinical tool is often the discipline of these operational details.
The type of imaging task determines what the AI should output. Confusing the task leads to unrealistic expectations. A model that classifies “stroke likely” is not automatically able to outline the infarct core; a model that draws a lung mask is not necessarily able to detect a small nodule. Always connect task type → output type before evaluating usefulness.
Milestone: Connect task type to output type. If you know whether you need a score, a box, a mask, or a measurement, you can judge whether the AI is fit for purpose and what validation is required. For example, triage tools prioritize high sensitivity and fast turnaround, while measurement tools prioritize consistency and calibration. Aligning outputs with workflow is the difference between a tool clinicians trust and one they ignore.
1. In this chapter’s framing, what is the most accurate description of what a medical scan is to an AI model?
2. Why does the chapter say labels (e.g., “pneumothorax present”) are hard to get right?
3. What is the key difference between training and inference in this chapter’s pipeline view?
4. According to the chapter, which statement best captures the model’s limitation regarding clinical context?
5. How does task type relate to what the AI produces, per the chapter?
When people hear “AI in radiology,” they often picture a computer replacing the radiologist. In real clinical practice, the highest-impact uses look different: AI acts like workflow glue and a consistency tool. It helps the team move faster through routine steps, reduces delays for urgent cases, and makes measurements and reporting more standardized. This chapter focuses on where AI tends to help most in day-to-day imaging workflows—because that is where it can deliver value without requiring perfect, human-level “understanding.”
A practical way to think about matching AI to problems is to start with bottlenecks rather than algorithms. Where do delays happen? Where do humans get interrupted? Where does fatigue cause variability? Where is there high volume, repetitive measurement, or high stakes for missing time-critical findings? These are the places where AI tools—often narrow, single-purpose models—fit naturally into the workflow.
Across modalities (CT, MRI, X-ray, ultrasound) and specialties, most deployed tools fall into a few repeatable patterns: triage and prioritization, detection support, measurement and tracking, workflow automation, and reporting support. Each pattern comes with common engineering judgement calls (thresholds, integration points, quality gates) and predictable failure modes (bad data, distribution shift, bias, drift). The goal is not to “trust AI,” but to build good human–AI teamwork: AI suggests, flags, or pre-fills; clinicians verify, interpret, and decide.
The sections below walk through the common use cases and what “good” looks like in practice—both for patient impact and for the imaging team.
Practice note for Milestone: Match AI tools to common imaging problems and bottlenecks: document your objective, define a measurable success check, and run a small experiment before scaling. Capture what changed, why it changed, and what you would test next. This discipline improves reliability and makes your learning transferable to future projects.
Practice note for Milestone: Understand triage and prioritization use cases: document your objective, define a measurable success check, and run a small experiment before scaling. Capture what changed, why it changed, and what you would test next. This discipline improves reliability and makes your learning transferable to future projects.
Practice note for Milestone: See how AI supports consistency and measurements: document your objective, define a measurable success check, and run a small experiment before scaling. Capture what changed, why it changed, and what you would test next. This discipline improves reliability and makes your learning transferable to future projects.
Practice note for Milestone: Learn what good human-AI teamwork looks like: document your objective, define a measurable success check, and run a small experiment before scaling. Capture what changed, why it changed, and what you would test next. This discipline improves reliability and makes your learning transferable to future projects.
Practice note for Milestone: Recognize what “value” means for patients and teams: document your objective, define a measurable success check, and run a small experiment before scaling. Capture what changed, why it changed, and what you would test next. This discipline improves reliability and makes your learning transferable to future projects.
Practice note for Milestone: Match AI tools to common imaging problems and bottlenecks: document your objective, define a measurable success check, and run a small experiment before scaling. Capture what changed, why it changed, and what you would test next. This discipline improves reliability and makes your learning transferable to future projects.
Practice note for Milestone: Understand triage and prioritization use cases: document your objective, define a measurable success check, and run a small experiment before scaling. Capture what changed, why it changed, and what you would test next. This discipline improves reliability and makes your learning transferable to future projects.
Practice note for Milestone: See how AI supports consistency and measurements: document your objective, define a measurable success check, and run a small experiment before scaling. Capture what changed, why it changed, and what you would test next. This discipline improves reliability and makes your learning transferable to future projects.
Triage tools aim to reduce time-to-action by moving potentially urgent studies to the top of the worklist. Classic examples include flagging possible intracranial hemorrhage on non-contrast head CT, large-vessel occlusion on CTA, pneumothorax on chest X-ray, or pulmonary embolism on CTPA. The clinical workflow problem is not that radiologists cannot find these; it is that a critical scan can sit behind dozens of routine studies during peak volume.
In practice, triage AI is a prioritization signal, not a diagnosis. A well-designed system may mark a study as “needs sooner review” and push it up the queue. Engineering judgement is mostly about thresholds and escalation rules: set the sensitivity high enough to catch most true emergencies, while controlling false alarms so the worklist does not become noisy. Sites often choose different operating points depending on staffing, case mix, and tolerance for interruptions.
Common mistakes include treating the flag as a guarantee (automation bias) or using triage AI as a substitute for proper communication pathways. For example, even if a scan is flagged, the protocol for contacting the clinical team about critical results still must be followed. Another failure mode is drift: a new scanner, reconstruction algorithm, or contrast timing changes the image appearance and can quietly reduce triage performance. A practical safeguard is continuous monitoring: track alert rates, positive predictive value, and the fraction of flagged cases that became true critical findings.
Good human–AI teamwork here looks like: the AI helps you find the “needle in the haystack” sooner, but the clinician still verifies the finding, interprets context, and initiates the appropriate response.
Detection support tools function like a second reader: they point out candidate abnormalities or regions of interest while leaving the final call to the radiologist. This pattern is common in mammography (lesion marking), lung nodule detection on chest CT, fracture detection on radiographs, or intracranial aneurysm candidates on angiography. The workflow bottleneck is perceptual: humans can miss subtle findings, especially under time pressure or fatigue.
The practical benefit is consistency. Even excellent readers have variability across days and workloads. A model that highlights candidates can reduce “search errors” (not looking in the right place) and “satisfaction of search” errors (stopping after finding one abnormality). However, detection assistance also creates new work: every prompt must be evaluated. That is why model design and integration matter—too many false positives can slow the reader and reduce trust.
Engineering judgement includes how prompts appear (heatmaps, boxes, ranked lists), when they are revealed (before or after the radiologist’s initial read), and whether the system can be tuned by site. Some departments prefer a “silent first pass” where the reader interprets independently, then checks AI marks to avoid anchoring. Others prefer immediate prompts for speed. The best choice depends on the clinical context and training culture.
Common mistakes include assuming generalization across populations. A fracture detector trained mostly on adult images may underperform in pediatrics; a nodule detector trained on one CT protocol may struggle with low-dose screening vs. diagnostic scans. Treat detection AI as a tool with a scope statement: what modalities, protocols, and patient groups it was validated on. When used within scope, it can meaningfully reduce misses without replacing clinical judgment.
Many high-value imaging tasks are not about “finding” something new, but about measuring it consistently and comparing over time. Examples include tumor burden measurements (longest diameter, RECIST-style), volumetric assessment of lung nodules, cardiac function estimates, brain structure volumes, or quantifying hemorrhage size. Humans can do these measurements, but manual steps are time-consuming and variable—two readers may measure slightly different slices or boundaries and reach different conclusions about change.
AI can help by segmenting structures, suggesting measurements, and tracking the same lesion across prior studies. This is where beginners often see the most tangible benefit: time saved and less variability. If a model proposes a segmentation, the radiologist can adjust it rather than starting from scratch. Over many cases, this can improve consistency in follow-up recommendations and oncologic response assessment.
The practical workflow details matter. For tracking, the system must reliably match priors, align anatomy, and present changes clearly. A good interface shows: current measurement, prior measurement, time interval, and a visual overlay. It also makes uncertainty visible—e.g., low confidence when motion artifact or poor contrast limits boundary definition.
Common failure modes include “garbage in, garbage out”: motion, metal artifact, incomplete coverage, or unusual anatomy can break segmentations. Another risk is false precision: a computed volume may look authoritative even when boundaries are questionable. Good teamwork means clinicians treat AI measurements as drafts, verify plausibility, and document when measurements are unreliable. In many departments, this is also the gateway to more structured longitudinal care, because standardized measurements make downstream decision-making clearer for the care team.
Some of the most reliable wins come from workflow automation that does not require the model to “diagnose” anything. These tools reduce friction around how images move and how they are presented. Examples include automatically routing studies to subspecialty worklists, selecting hanging protocols (how series are arranged on the screen), or running quality checks such as verifying laterality markers, confirming adequate contrast timing, detecting missing series, or flagging motion artifacts.
These use cases align well with engineering realities: they are narrower, easier to validate, and often less sensitive to clinical ambiguity. The value is operational: fewer interruptions, fewer “can you resend the series?” calls, and fewer delays caused by preventable acquisition issues. For technologists, automated quality prompts can catch problems early—before the patient leaves—reducing repeat scans and improving patient experience.
Integration is the main challenge. The AI must connect to the PACS/RIS, understand study metadata, and act at the right time. For instance, a quality check that runs after the exam is finalized is less useful than one that runs during acquisition. Another judgement call is how aggressive automation should be: auto-routing without oversight can misdirect edge cases, while “suggested routing” with human confirmation can be safer but slower.
Common mistakes include underestimating local variation. Different sites label series differently, follow different protocols, and have different scanner vendors. Workflow AI often needs site-specific configuration and ongoing maintenance—especially after protocol changes. When implemented thoughtfully, this category quietly improves throughput and reduces cognitive load across the entire imaging chain.
Reporting is where imaging findings become actionable information. AI can help by suggesting structured fields, extracting measurements into the report, offering standardized language, and checking for missing key elements (for example, nodule size and recommended follow-up). This is less about replacing the radiologist’s narrative and more about reducing variability and omissions that can affect downstream care.
A practical example is a chest CT report where the AI measurement tool has already captured a nodule’s diameter and location. The reporting assistant can pre-fill those values into a structured template, along with prior comparisons. Another example is consistency checks: if the impression mentions “no pulmonary embolism,” but a key sequence is missing or contrast timing is poor, the system can prompt the reader to confirm adequacy or add a limitation statement.
Engineering judgement revolves around minimizing extra clicks. If the radiologist has to fight the template, productivity drops and adoption fails. Good systems make it easy to accept, edit, or reject suggestions. They also preserve accountability: the final signed report is the clinician’s responsibility, and any AI-generated text should be clearly reviewable.
Common mistakes include over-standardization that removes nuance. Not every case fits a rigid template, and forcing structure can lead to inaccurate or incomplete communication. The best human–AI teamwork uses structure where it helps (measurements, key descriptors, follow-up logic) while keeping room for expert interpretation and tailored recommendations.
To recognize real “value,” you need metrics that reflect patient care and team performance—not just model accuracy in a demo. In clinical workflows, common success measures include turnaround time (TAT), time-to-critical-result communication, reduction in repeat imaging, improved consistency of measurements, and fewer preventable misses. Importantly, each metric must be interpreted in context: a tool that increases sensitivity may also increase false positives and reading time, so the net effect on workflow must be measured.
For triage, meaningful metrics include: median and 90th-percentile time from acquisition to first review for flagged conditions, and time to clinical notification. For detection support, look at changes in discrepancy rates on peer review, addendum rates, and reader workload. For measurement tools, track inter-reader variability and time spent per case. For workflow automation, measure rework rates (missing series, protocol mismatches) and scanner throughput.
Patient-centered outcomes are harder but essential: earlier treatment initiation, fewer complications from delayed diagnosis, or reduced radiation from avoided repeats. Not every site can run large outcome studies, but even small, well-designed audits help determine whether the tool is improving care.
Common mistakes include chasing a single number (like sensitivity) and ignoring operational trade-offs. Another is failing to monitor after go-live. Real-world use changes: protocols evolve, populations shift, and performance can drift. A practical success plan includes baseline measurement, a pilot period, feedback loops with radiologists and technologists, and ongoing monitoring dashboards. When success is defined clearly and measured continuously, AI becomes a dependable workflow partner rather than a one-time experiment.
1. According to the chapter, the highest-impact role of AI in real radiology workflows is usually to:
2. A practical way to match AI tools to clinical needs, as described in the chapter, is to start by identifying:
3. Which set best reflects the repeatable patterns where deployed imaging AI tools commonly fit?
4. What does the chapter describe as the goal of good human–AI teamwork?
5. In the chapter’s framing of “value,” which outcome best matches what AI should deliver for patients and imaging teams?
When an AI tool is marketed for medical imaging, the brochure often leads with a single number: “95% accuracy,” “AUC 0.92,” or “sensitivity 0.98.” These numbers can be useful, but only if you understand what question they answer—and what they ignore. Performance in medical imaging is never just a math exercise. It is a clinical safety question: who gets flagged, who gets missed, how often, and in what settings.
This chapter builds practical intuition for the most common evaluation terms. You will learn how to read performance claims the way a careful buyer or clinical champion would: by mapping numbers to patient outcomes (false alarms and missed findings), checking whether the evaluation matches your real-world prevalence, and interpreting “better” metrics with the correct safety lens. You will also learn why evaluation is tricky in imaging: ground truth can be uncertain, radiologists disagree, and the same model can behave differently across hospitals, scanners, and protocols.
The key skill is engineering judgment: translating metrics into operating decisions. An AI triage tool for head CT might aim to minimize missed bleeds (even if it creates many alerts), while an AI tool that autogenerates measurements might aim to avoid false measurements that waste time or mislead reports. The same model can look “good” on paper and still be unsafe if its threshold, test population, or reference standard does not match the clinical reality.
In the sections that follow, we will anchor each metric to a concrete workflow: a clinician looking at a flagged study, a patient being recalled for follow-up, or a missed finding that delays treatment. That is what the numbers really mean.
Practice note for Milestone: Build intuition for sensitivity and specificity: document your objective, define a measurable success check, and run a small experiment before scaling. Capture what changed, why it changed, and what you would test next. This discipline improves reliability and makes your learning transferable to future projects.
Practice note for Milestone: Understand false positives vs false negatives in patient terms: document your objective, define a measurable success check, and run a small experiment before scaling. Capture what changed, why it changed, and what you would test next. This discipline improves reliability and makes your learning transferable to future projects.
Practice note for Milestone: Learn why prevalence changes perceived performance: document your objective, define a measurable success check, and run a small experiment before scaling. Capture what changed, why it changed, and what you would test next. This discipline improves reliability and makes your learning transferable to future projects.
Practice note for Milestone: Interpret validation claims and compare tools carefully: document your objective, define a measurable success check, and run a small experiment before scaling. Capture what changed, why it changed, and what you would test next. This discipline improves reliability and makes your learning transferable to future projects.
Practice note for Milestone: Know when “better accuracy” can still be unsafe: document your objective, define a measurable success check, and run a small experiment before scaling. Capture what changed, why it changed, and what you would test next. This discipline improves reliability and makes your learning transferable to future projects.
Practice note for Milestone: Build intuition for sensitivity and specificity: document your objective, define a measurable success check, and run a small experiment before scaling. Capture what changed, why it changed, and what you would test next. This discipline improves reliability and makes your learning transferable to future projects.
Practice note for Milestone: Understand false positives vs false negatives in patient terms: document your objective, define a measurable success check, and run a small experiment before scaling. Capture what changed, why it changed, and what you would test next. This discipline improves reliability and makes your learning transferable to future projects.
Almost every performance metric in medical imaging can be traced back to a simple 2×2 table called the confusion matrix. To build intuition, imagine an AI tool that flags chest X-rays for possible pneumothorax. Each case has two “labels”: the ground truth (pneumothorax present or absent) and the AI output (flag or no flag). From that, four outcomes are possible.
This table is more than vocabulary—it forces you to specify what counts as the “positive” condition. In imaging, “positive” might mean “intracranial hemorrhage,” “pulmonary embolism,” “lung nodule ≥ 6 mm,” or “fracture.” Different definitions change the matrix. For example, if the tool is evaluated only on large bleeds, it may look excellent while missing subtle hemorrhages that still matter clinically.
Common mistakes start here. First, people mix up unit of analysis: per-image, per-slice, per-lesion, or per-patient. A CT scan with three pulmonary emboli could be scored as one positive patient, or three lesions—those give different TP/FP/FN counts. Second, labeling can be inconsistent: if “ground truth” comes from a radiology report, cases with ambiguous language (“cannot exclude”) may be mislabeled, inflating or deflating errors.
Practically, when a vendor presents a metric, ask for the confusion matrix (or enough data to derive it) on a dataset that resembles your workflow. It is the quickest way to compare tools carefully and to predict what clinicians will experience: how many extra reads per day from FP alerts, and how many missed cases from FN errors.
Sensitivity and specificity are the two most common “first-pass” metrics in imaging AI. They answer different questions, and they protect against different failure modes.
In patient terms, sensitivity is about misses (false negatives). If an AI triage tool has low sensitivity for intracranial hemorrhage, it may fail to prioritize a critical scan, delaying care. Specificity is about false alarms (false positives). If an AI nodule detector has low specificity, it can trigger unnecessary follow-up CTs, patient anxiety, added cost, and clinician “alert fatigue,” where staff start ignoring the AI.
Neither metric is “better” in isolation. The right balance depends on the task. A triage tool often emphasizes sensitivity because the clinical harm of missing a critical finding can be severe. A tool that inserts statements into reports may emphasize specificity because incorrect statements can propagate into clinical decisions. In measurement tools, a false positive measurement (marking a normal structure as a lesion) can waste time and undermine trust; here, high specificity may be crucial for adoption.
Engineering judgment shows up in how you interpret a vendor claim like “97% sensitivity.” Ask: sensitivity for what? On which population? Was it measured per patient or per lesion? What is the confidence interval (how stable is the estimate)? And what was the paired specificity at the same setting? High sensitivity can be achieved by flagging almost everything, which may be unsafe operationally even if it looks “good” on a single metric.
A practical outcome: before deployment, teams should simulate the clinical workload. Convert sensitivity and specificity into expected FP and FN counts per day in your department, then decide whether the workflow can absorb those alerts and whether misses are acceptable given the tool’s intended use.
Sensitivity and specificity condition on the truth (“given disease, what does the model do?”). Clinicians often need the reverse: “given the AI says positive, what is the chance it’s real?” That is positive predictive value (PPV). Similarly, “given the AI says negative, what is the chance the patient is truly negative?” is negative predictive value (NPV).
Here is the crucial point: PPV and NPV depend heavily on prevalence—how common the condition is in the population being tested. This is why the same model can feel accurate in one setting and annoying in another. If prevalence is low (rare disease), even a small false-positive rate can produce many false alarms, driving PPV down.
Consider an AI tool used in two scenarios: (1) emergency department head CTs for suspected bleed (higher prevalence), and (2) screening or broad inpatient imaging where bleed is rare (lower prevalence). With the same sensitivity and specificity, PPV will usually be higher in the ED use case because more positives are real. In the low-prevalence setting, clinicians may see many flagged studies that turn out normal; the tool might still be mathematically “good,” but operationally frustrating.
This is a common way prevalence changes perceived performance: teams adopt a tool based on a published validation with enriched positives (many disease cases included on purpose), then deploy into a general population where positives are rare. The deployed PPV drops, and trust erodes. When interpreting validation claims, look for the prevalence in the test set and compare it to your expected prevalence. If they do not match, ask the vendor to provide projected PPV/NPV for your setting or allow a local silent trial to measure it.
Practical takeaway: for triage tools, PPV affects how many “urgent” flags are truly urgent; for rule-out tools, NPV affects whether clinicians can safely deprioritize a case. Both should be evaluated with your workflow and prevalence in mind, not only the vendor’s dataset.
Many imaging AI models output a score (for example, 0 to 1) representing confidence of a finding. A threshold converts that score into a decision: above the threshold is “positive,” below is “negative.” Changing the threshold changes the confusion matrix—so it changes sensitivity, specificity, PPV, and NPV. This is why a single model can have many operating points.
The ROC curve plots sensitivity (true positive rate) versus false positive rate (1 − specificity) as you sweep the threshold. The ROC-AUC (area under the curve) summarizes how well the model ranks positives above negatives across all thresholds. An AUC of 0.5 is random; 1.0 is perfect ranking.
AUC is useful for comparing models in a general sense, but it can be misleading for deployment decisions. You do not deploy “across all thresholds”—you deploy at one threshold. A model with slightly lower AUC may be safer at the specific sensitivity level you require, especially if the ROC curves cross. Also, AUC does not tell you the operational cost of false positives in your workflow, which can dominate the real-world experience.
To know when “better accuracy” can still be unsafe, focus on the selected operating point. A vendor might advertise improved accuracy by moving the threshold to reduce false positives, but that may increase false negatives—potentially unacceptable for time-critical diagnoses. Or the threshold might have been tuned on a dataset that does not match your prevalence, shifting PPV dramatically once deployed.
Practically, evaluation should include threshold selection criteria aligned to clinical goals: e.g., “set threshold to achieve at least 98% sensitivity for hemorrhage on a representative dataset, then report the resulting specificity and expected alerts per day.” If the tool supports adjustable thresholds, governance should define who is allowed to change them, how changes are validated, and how monitoring will detect performance drift after threshold adjustments.
In medical imaging, “ground truth” is often not a simple yes/no. Some findings are subjective, subtle, or evolve over time. A radiology report may be incomplete, the true diagnosis may require follow-up imaging, and even experts can disagree. This makes evaluation tricky and can distort metrics if handled poorly.
Reader studies are a common way to evaluate AI: multiple radiologists interpret a set of cases, sometimes with and without AI assistance. The design details matter. Was it a crossover design (same readers, different conditions)? Were there washout periods to reduce memory effects? Were readers representative of the target users (generalists vs subspecialists)? A tool can appear to help in a study with fatigued residents and appear less helpful with experienced neuroradiologists—or vice versa.
Ground truth can be established in different ways, each with tradeoffs:
When comparing tools carefully, check whether they were evaluated against the same reference standard. An AI evaluated against “report labels” may score higher simply because it learned report-writing patterns rather than true pathology. Also examine how indeterminate cases were treated; excluding hard cases can inflate performance. Confidence intervals and subgroup analysis (by body habitus, age, comorbidities, and imaging quality) help reveal instability.
Practically, before adopting claims like “AI improves radiologist accuracy,” ask what outcome was measured: sensitivity at the same reading time? Reduced misses on a specific pathology? Fewer callbacks? A tool may increase sensitivity but also increase reading time or false positives, shifting workload and downstream testing. The safest evaluation ties back to workflow outcomes, not only a headline metric.
A model can test well and still fail in real-world use because the world changes. In medical imaging, differences across hospitals are not minor—they can be fundamental. Scanner manufacturers, reconstruction kernels, dose settings, contrast timing, patient positioning, and local protocols all shape the pixel data. Even reporting styles and patient populations vary. This is why generalization—performing well outside the training environment—is a central safety concern.
Common failure modes include:
This connects to the earlier milestone of understanding training vs testing vs real-world use. A vendor’s “test set” might be multi-center, but still not include your exact scanner model or your acquisition protocol. The model can latch onto shortcuts (for example, a particular annotation style or acquisition pattern correlated with disease) that do not hold elsewhere. Performance then drops silently, especially if no one is monitoring false negatives.
Practically, insist on evidence of external validation across multiple institutions and, ideally, prospective evaluation. Before full deployment, run a local validation (often called a silent or shadow mode trial) where the AI produces outputs without influencing care, allowing you to measure local sensitivity, specificity, and alert volume. After deployment, set up ongoing monitoring: track positivity rates, compare against radiologist outcomes, audit a sample of negatives for potential misses, and re-validate after major scanner or protocol changes.
The operational goal is not to prove the model is perfect, but to know where it is reliable, where it is fragile, and what safeguards exist when it is wrong. In imaging AI, safety comes from combining measured performance with continuous oversight and a workflow that anticipates failure.
1. A brochure claims an imaging AI has “95% accuracy.” What is the most clinically appropriate next step before trusting that number?
2. Which statement best captures why prevalence changes perceived performance in practice?
3. An AI triage tool for head CT is intended to minimize missed bleeds. Which operating choice aligns with that safety goal?
4. Why can the same model look “good” on paper but be unsafe in a real hospital?
5. Which interpretation best matches the chapter’s point that metrics are conditional statements?
Medical imaging AI can be genuinely helpful—highlighting potential findings, prioritizing worklists, measuring lesions, or drafting structured phrases. But the same “pattern recognition” that makes AI powerful also makes it fragile when the real world deviates from the conditions the model learned from. This chapter focuses on what to watch for: common failure modes, where bias comes from, how models can learn the wrong lessons, why performance can degrade over time, and what practical safety habits reduce risk.
Think of imaging AI as a specialized tool, not a general clinician. It does not “understand” anatomy, pathophysiology, or patient context the way people do. It maps inputs (pixels and metadata) to outputs (scores, boxes, segments, or text suggestions) based on patterns seen during training. That means failures often look like: confident errors in unusual cases, poorer performance in underrepresented patient groups, or subtle drops in quality after scanners, protocols, or patient mix change.
To keep things beginner-friendly, you can treat risk management as five milestones: (1) identify how AI fails in practice, (2) understand bias and fairness, (3) learn drift and monitoring, (4) practice a simple risk checklist for safe use, and (5) know when to escalate concerns and pause deployment. The sections below walk through each, using concrete imaging examples and operational guardrails you can apply even if you are not a data scientist.
Practice note for Milestone: Identify common ways imaging AI fails in the real world: document your objective, define a measurable success check, and run a small experiment before scaling. Capture what changed, why it changed, and what you would test next. This discipline improves reliability and makes your learning transferable to future projects.
Practice note for Milestone: Understand bias and fairness in beginner-friendly terms: document your objective, define a measurable success check, and run a small experiment before scaling. Capture what changed, why it changed, and what you would test next. This discipline improves reliability and makes your learning transferable to future projects.
Practice note for Milestone: Learn about drift, updates, and monitoring needs: document your objective, define a measurable success check, and run a small experiment before scaling. Capture what changed, why it changed, and what you would test next. This discipline improves reliability and makes your learning transferable to future projects.
Practice note for Milestone: Practice a simple risk checklist for safe use: document your objective, define a measurable success check, and run a small experiment before scaling. Capture what changed, why it changed, and what you would test next. This discipline improves reliability and makes your learning transferable to future projects.
Practice note for Milestone: Know when to escalate concerns and pause deployment: document your objective, define a measurable success check, and run a small experiment before scaling. Capture what changed, why it changed, and what you would test next. This discipline improves reliability and makes your learning transferable to future projects.
Practice note for Milestone: Identify common ways imaging AI fails in the real world: document your objective, define a measurable success check, and run a small experiment before scaling. Capture what changed, why it changed, and what you would test next. This discipline improves reliability and makes your learning transferable to future projects.
Practice note for Milestone: Understand bias and fairness in beginner-friendly terms: document your objective, define a measurable success check, and run a small experiment before scaling. Capture what changed, why it changed, and what you would test next. This discipline improves reliability and makes your learning transferable to future projects.
Practice note for Milestone: Learn about drift, updates, and monitoring needs: document your objective, define a measurable success check, and run a small experiment before scaling. Capture what changed, why it changed, and what you would test next. This discipline improves reliability and makes your learning transferable to future projects.
Practice note for Milestone: Practice a simple risk checklist for safe use: document your objective, define a measurable success check, and run a small experiment before scaling. Capture what changed, why it changed, and what you would test next. This discipline improves reliability and makes your learning transferable to future projects.
Many real-world AI failures are not “smart model problems” but “bad input problems.” Imaging AI usually assumes that the incoming study looks like the training studies: similar views, similar patient positioning, similar dose/contrast, and readable pixel data. When those assumptions break, the model can misfire—sometimes silently.
Common data quality risks include motion blur (patient movement during CT/MRI), metal artifacts (orthopedic hardware streaking), poor breath-hold (chest CT with atelectasis-like blur), low-dose noise, and clipping/saturation in X-ray. Another frequent issue is missing views or incomplete exams: a mammogram missing a standard view, a CXR with rotated positioning, or an ultrasound series without the expected labels. Models trained on complete, “textbook” sets may produce overconfident outputs on incomplete ones.
Practical steps: verify that DICOM series selection is correct (wrong series in, wrong answer out), define minimum quality thresholds (e.g., acceptable slice thickness or required views), and log “AI abstains” rates. A rising abstain rate can be an early warning of workflow changes or scanner/protocol drift.
This section maps to the milestone of identifying common ways imaging AI fails in the real world: data problems are the most common and the easiest to prevent with simple checks and clear escalation paths.
Bias in imaging AI often comes from representation: who was included in the training data, and under what clinical conditions. If a model mostly saw data from one hospital, one scanner vendor, one geography, or one patient demographic, it may underperform elsewhere—even if its headline accuracy looked excellent.
At a beginner level, you can think of “fairness” as: does the tool work reliably for the patients you actually serve? In imaging, this can vary by age (pediatric vs adult anatomy), sex (e.g., breast density patterns), body habitus (obesity affecting image quality), skin tone indirectly (through correlated factors like acquisition settings), language/location (workflow differences), and disease prevalence (screening populations vs tertiary referral centers). Bias can also appear through care pathways: if certain groups are more likely to get portable CXRs or suboptimal positioning, the model may have less experience with those patterns.
Practical outcome: if you discover a subgroup gap (e.g., worse sensitivity in older patients or specific scanner models), you can set guardrails: limit deployment scope, route those cases to standard reading, or require a second human check. This is the milestone of understanding bias and fairness in plain terms—bias is often a data coverage problem that must be measured, not assumed away.
Even when training data is large, models can learn the “wrong lesson.” This is called shortcut learning: the AI finds an easy-to-predict signal that correlates with the label in training, but is not the true medical finding. Because the shortcut works on the training and test sets, performance metrics can look strong—until the shortcut breaks in real use.
Classic shortcut cues in medical imaging include text overlays (“portable,” “ICU”), scanner-specific pixel patterns, laterality markers, or hospital-specific post-processing. For example, if many positive cases in the training set came from a particular unit and those images include a consistent annotation style, the model may partially learn the annotation, not the pathology. Another shortcut is “presence of devices”: if severe cases are more likely to have tubes/lines, the model may associate devices with disease and overcall findings in stable patients who happen to have hardware.
Practical judgment for beginners: be skeptical of “too good to be true” gains. If a model improves dramatically without a clear clinical reason, ask what it might be exploiting. This section supports the milestone of identifying real-world failure modes—shortcut learning creates failures that feel confusing because the images “look fine” to humans, yet the model behaves inconsistently.
Training and testing happen on a snapshot of reality. Deployment happens in a moving world. Distribution shift means the incoming cases differ from what the model saw before. Drift is the gradual or sudden change over time that causes performance to degrade.
In imaging, shift can come from new scanner hardware, software upgrades, reconstruction algorithms, protocol changes (slice thickness, contrast timing), new patient populations, or new clinical guidelines that change which cases get imaged. Even a change in ordering behavior—more outpatient scans or a new screening program—can alter disease prevalence, which affects how useful sensitivity/specificity feel in practice (for example, a triage tool may produce many more false positives when prevalence drops).
This section connects directly to the milestone of learning about drift, updates, and monitoring needs. A safe program assumes drift will happen and builds detection and response into routine operations, rather than waiting for a major incident.
Some of the biggest risks are human, not technical. Automation bias happens when people over-trust a tool’s output, especially when it looks authoritative, is integrated tightly into workflow, or saves time. In imaging, an AI triage flag or “likely negative” label can subtly change how carefully a clinician reviews a case.
Overreliance often appears in two forms: (1) commission—accepting an incorrect AI suggestion (e.g., copying an AI-generated sentence into a report without verifying), and (2) omission—failing to act because AI didn’t flag something (e.g., overlooking a subtle PE because the AI detection box is absent). Time pressure and alert fatigue amplify both.
Practical outcome: a safer workflow makes it easy to disagree with the AI. For example, include a one-click “AI incorrect” feedback option and ensure it does not create extra burden. This supports the milestone of practicing a simple risk checklist: part of the checklist is ensuring humans remain active decision-makers, not passive acceptors.
Safe use is not a single approval step; it is a continuous process. The goal is to reduce harm, detect issues early, and respond consistently. You can implement a practical safety program with guardrails, audits, and clear incident reporting—without needing advanced machine learning expertise.
Guardrails start with scope: define the exact modality, protocol, patient population, and clinical question the AI supports. Add “abstain” rules for insufficient image quality or missing views. Require version control and ensure the displayed model version matches the validated one. If AI affects triage, ensure the baseline workflow still functions safely when AI is down.
Finally, know when to escalate and pause deployment. Escalate immediately if you observe systematic errors (same failure repeated), harm or near-harm, sudden output distribution changes, or performance drops after environment changes (scanner/protocol/software). Pausing is not failure—it is a safety action. A mature program treats pauses as expected responses to new evidence, then resumes only after root-cause analysis, mitigation, and re-validation.
1. Why can a medical imaging AI that works well in testing fail in real-world use?
2. Which situation best matches a common failure mode described in the chapter?
3. In beginner-friendly terms, what is a key source of bias in imaging AI performance?
4. What does the chapter mean by drift, and why does it matter?
5. According to the chapter’s safety mindset, what is the most appropriate way to treat imaging AI in clinical workflows?
By this point, you know what imaging AI tries to do (assist detection, triage, measurement, and reporting) and where it can fail (bad data, bias, drift). The next beginner milestone is adoption: how to use AI in a real hospital or clinic without creating privacy problems, workflow chaos, or false confidence. This chapter focuses on practical “first steps” and the engineering judgment behind them—what you should check before purchase, how to roll out safely, and what to monitor after go-live.
A useful mindset: adoption is not a single decision (“we bought AI”). It is a chain of decisions—data handling, security, regulatory fit, clinical oversight, integration, and ongoing monitoring. Each link has different owners. When something goes wrong, it is usually because one link was assumed instead of verified (for example, believing “the vendor is approved” means “it will work in our patient population” or assuming “de-identified” means “no privacy risk”).
The goal is not to become a lawyer or an IT security engineer. The goal is to ask the right questions, document answers, and set up accountable processes so the tool helps patients rather than adding risk.
Practice note for Milestone: Understand privacy and consent basics for imaging data: document your objective, define a measurable success check, and run a small experiment before scaling. Capture what changed, why it changed, and what you would test next. This discipline improves reliability and makes your learning transferable to future projects.
Practice note for Milestone: Learn the “who does what” for accountability and oversight: document your objective, define a measurable success check, and run a small experiment before scaling. Capture what changed, why it changed, and what you would test next. This discipline improves reliability and makes your learning transferable to future projects.
Practice note for Milestone: Recognize the role of regulators and clinical validation: document your objective, define a measurable success check, and run a small experiment before scaling. Capture what changed, why it changed, and what you would test next. This discipline improves reliability and makes your learning transferable to future projects.
Practice note for Milestone: Build a beginner-friendly procurement and rollout plan: document your objective, define a measurable success check, and run a small experiment before scaling. Capture what changed, why it changed, and what you would test next. This discipline improves reliability and makes your learning transferable to future projects.
Practice note for Milestone: Create a clear set of questions to ask vendors: document your objective, define a measurable success check, and run a small experiment before scaling. Capture what changed, why it changed, and what you would test next. This discipline improves reliability and makes your learning transferable to future projects.
Imaging data is personal health information. A CT scan or MRI is not just pixels—it often contains identifiers in headers (such as DICOM tags) and sometimes in the image itself (burned-in text). Privacy basics for AI adoption start with two ideas: (1) minimize identifiable data exposure, and (2) tightly control who can access what.
De-identification usually means removing or masking direct identifiers from imaging metadata (patient name, MRN, birth date) and checking for burned-in annotations. However, de-identification is not the same as “risk-free.” Rare anatomy, facial features in head scans, or combinations of dates and locations can still re-identify someone in certain contexts. Treat de-identified data as sensitive unless you have a formal, documented process and risk assessment.
Consent and purpose matter. Using images to provide clinical care (AI assisting radiologists) is different from using images to train a new model or to improve a vendor’s product. In practice, ask: are images leaving your organization? Are they used only for inference (running the model) or also for development? Your compliance team should map this to local law and institutional policy.
Beginner outcome: you can explain, in plain language, how your organization prevents unnecessary exposure of imaging data and how access is granted, reviewed, and revoked.
Cybersecurity is part of patient safety. If an AI tool is compromised, the risk is not only data theft; it can also interrupt imaging operations or alter results. Imaging environments are complex: modalities, PACS, RIS, workstations, integration engines, and now AI servers—each one increases the attack surface.
Start with a simple security posture checklist: network segmentation, authentication, patching, logging, and incident response. Many AI products connect to PACS via DICOM and to clinical systems via HL7/FHIR. Those connections must be secured (encrypted transport where possible, least-privilege service accounts, and firewall rules restricting allowed endpoints).
A common beginner trap is focusing only on model performance and ignoring operational security. Another is treating cloud hosting as automatically secure; cloud can be secure, but only with correct configuration, auditability, and clear responsibility boundaries. Practical outcome: you can describe how the AI tool is protected, how failures are detected, and how care continues during outages.
Regulators (such as the FDA in the US or CE marking under the EU MDR) evaluate medical devices, including software that performs medical functions. For imaging AI, regulatory status is an important filter—but it is not a guarantee of success in your setting.
What approval generally means: the product has met certain safety and effectiveness requirements for a specific intended use, modality, anatomy, and clinical context. The labeling matters. If a tool is cleared for adult chest X-rays, that does not automatically cover pediatric cases or CT scans. If the intended use is “triage,” it may not be validated for standalone diagnosis.
What approval does not mean: it does not guarantee perfect performance on your scanners, your protocols, your patient demographics, or your workflow. It also does not mean the tool is immune to drift (performance changes over time due to new scanners, protocol changes, or population shifts). Approval is a baseline; local validation is your safety net.
Beginner outcome: you can explain the difference between “regulated for this use” and “proven to work here,” and you know why clinical validation and monitoring still matter after purchase.
AI adoption succeeds when accountability is explicit. “Who does what” should be written down before go-live. Clinical governance is the structure that ensures oversight, safe use, and continuous improvement.
Radiologists and clinical leaders define the clinical use case, acceptable error modes, and how AI outputs should be interpreted (assistive vs triage vs measurement). They also lead local validation: comparing AI results to radiologist reads, reviewing disagreements, and deciding whether performance is acceptable for routine use.
IT and imaging informatics manage integration, uptime, security controls, identity/access, and system monitoring. They should also maintain a configuration record: model version, routing rules, which studies are sent to AI, and where results return.
Compliance and privacy officers review data sharing, consent/notice requirements, vendor contracts (including data use clauses), and breach response obligations. They ensure the organization’s policies match what the system actually does.
Beginner outcome: you can point to a responsible owner for performance, for security, and for privacy—and you can describe how decisions are made when tradeoffs arise.
Most imaging AI tools live or die by workflow. Even a strong model can fail to deliver value if results arrive late, appear in the wrong place, or create extra clicks. A beginner-friendly way to think about integration is: images are acquired on a modality, stored in PACS, scheduled and tracked in RIS, interpreted in a viewer, and reported through dictation/reporting systems. AI must insert itself without breaking this chain.
Common integration patterns include sending studies from PACS (or a routing engine) to an AI server, then returning results as DICOM objects (secondary capture, structured report, overlays) or as worklist flags/notes. Decide where the radiologist will see the output: inside the viewer, in the worklist, or embedded in the report template.
A common mistake is adding AI as a separate portal, forcing radiologists to context-switch. Another is not planning for “no result” scenarios (network issues, unsupported studies). Practical outcome: AI results are delivered in the normal reading flow, with clear fallback behavior and minimal disruption.
Buying smart means treating AI like a clinical system, not a demo. Your vendor questions should cover evidence, fit, operational realities, and total cost of ownership. The goal is not to “catch” the vendor; it is to surface assumptions early and prevent surprises after contract signing.
Evidence and fit: Ask for peer-reviewed studies and real-world deployments similar to your setting. Request subgroup performance, scanner/protocol dependencies, and intended use limitations. Confirm how ground truth was established and whether the tool was tested prospectively or only retrospectively.
Monitoring and drift: Require a plan to track performance over time: model versioning, dashboards, and a process to review false positives/negatives. Clarify who is responsible for recalibration, updates, and communicating changes in behavior after a new model release.
Support and reliability: Define SLAs for uptime, response times, and escalation. Confirm how outages are handled and whether results are cached or regenerated. Ask about compatibility with your PACS/RIS/viewers and how integrations are tested.
Costs and contracts: Go beyond license fees. Include integration costs, hardware/cloud fees, cybersecurity reviews, training time, and ongoing maintenance. Review data rights clauses carefully: can the vendor use your images to retrain models, and under what conditions?
Beginner outcome: you can produce a clear question list and a simple rollout plan (pilot → validate locally → integrate into workflow → monitor continuously) that aligns privacy, regulation, and clinical accountability.
1. Which statement best matches the chapter’s “adoption” mindset for imaging AI?
2. According to the chapter, why do imaging AI deployments commonly go wrong in real settings?
3. Which example from the chapter shows a risky assumption a beginner should avoid?
4. What is the chapter’s recommended goal for beginners dealing with privacy, regulation, and oversight?
5. Which approach best reflects “buying smart” and rolling out safely as described in the chapter?
- Learning Evolved.
- Intelligence Amplified.